Stop Just Tracking Activity. Start Proving Impact.
April 15 & 16, 2026 • All Online
Learning leaders face growing pressure to prove how L&D drives real business impact—not just learning activity. It’s not enough just to collect and use data; you need to know how to effectively communicate the value of solutions to others in your organization.
This six-session online conference is designed to help you strengthen your skills in identifying learning evidence, interpreting it, and communicating it effectively to make a strong business case. You’ll walk away knowing how to use measurement as a strategic tool for better decisions and stronger alignment with organizational priorities.
Discover proven strategies to showcase the value of your learning, including how to:
- Pinpoint the indicators that matter most for decision-making, rather than relying on surface-level activity data
- Select measurement approaches that fit the questions being asked
- Make clear connections between learning initiatives, team priorities, and organizational results
- Apply practical tools, benchmarks, and concise summaries to improve alignment, communication, and action
NEW: Connect and exchange ideas with other attendees! At the end of each day, you’ll gather in small groups to reflect on key ideas from the sessions, share perspectives, and explore how you’ll apply what you’ve learned.
Program
DAY 1: April 15
Conference Introduction
10:45 AM – 11:15 AM ET / 7:45 AM – 8:15 AM PT
Join us for the opening session to learn more about the conference.
101: Beyond Compliance: Using Learning Analytics to Drive Engagement & Impact
Sandie Dela Cruz, Edwards Lifesciences
11:25 AM – 12:30 PM ET / 8:25 AM – 9:30 AM PT
“Many organizations struggle to move beyond compliance-based learning metrics, leaving valuable insights untapped.
Learn more.
201: Bring Your Data to Life with Dynamic Visual PowerPoint
Richard Goring, BrightCarbon
1:00 PM – 2:00 PM ET / 10:00 AM – 11:00 AM PT
Data is one of the core types of information you need to share with others, but in its raw form it can be anything but helpful. Often misleading, misinterpreted, or even irrelevant to the audience, data can be tricky to communicate effectively.
Learn more.
301: Measuring What Matters: A Practical Starting Point for Learning Impact
Amy Colasanti, AdventHealth
Natasha McIlmurray, AdventHealth
2:30 PM – 3:30 PM ET / 11:30 AM – 12:30 PM PT
Learning teams in every industry are under pressure to demonstrate impact, yet many struggle to move past completion and participation metrics without making measurement overly complicated. This session explores how AdventHealth prototyped a practical digital learning impact strategy using a 120-day baseline approach.
Learn more.
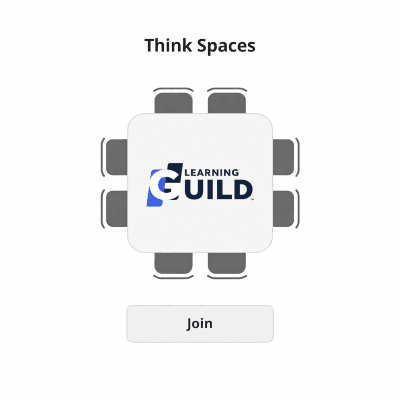
Think Spaces: Real people discussing real things
Think Spaces, The Learning Guild
3:35 PM – 4:35 PM ET / 12:35 PM – 1:35 PM PT
Join us for focused, small group table conversations where you can explore industry topics and build meaningful professional connections.
These sessions are intentionally designed to be semi-structured, practical, and relevant.
Why join:
• Topic driven tables with curated springboard questions
• Small (6 person max) groups for deeper networking
• A welcoming space to explore ideas with peers
DAY 2: April 16
401: The L&D Metrics Hierarchy: Mapping Learning Data to Business Outcomes
Monica Gragg, Onward Energy
11:30 AM – 12:30 PM ET / 8:30 AM – 9:30 AM PT
Most L&D teams either track everything—or nothing at all. They collect dozens of metrics that don’t matter or rely on completion rates that say little to executives.
Learn more.
501: Showing Value While You Build
Armando Contreraz, Wireless CCTV USA
1:00 PM – 2:00 PM ET / 10:00 AM – 11:00 AM PT
Many L&D teams are expected to show value while programs are still being built, priorities are shifting, and resources are limited. This session focuses on how to communicate progress and impact during growth, not just after everything is complete.
Learn more.
601: Speaking Data: The Language of Impact and Behavior Change
Zsolt Olah, Intel
2:30 PM – 3:30 PM ET / 11:30 AM – 12:30 PM PT
L&D teams often report data accurately from learning needs assessments, surveys, or evaluations. This is a good first step! Taking it to the next level is about turning data into actionable insights for stakeholders.
Learn more.
Think Spaces: : Real people discussing real things
Think Spaces, The Learning Guild
3:35 PM – 4:35 PM ET / 12:35 PM – 1:35 PM PT
Join us for focused, small group table conversations where you can explore industry topics and build meaningful professional connections.
These sessions are intentionally designed to be semi-structured, practical, and relevant.
Why join:
• Topic driven tables with curated springboard questions
• Small (6 person max) groups for deeper networking
• A welcoming space to explore ideas with peers
101: Beyond Compliance: Using Learning Analytics to Drive Engagement & Impact
11:25 AM – 12:30 PM ET / 8:25 AM – 9:30 AM PT Wednesday, April 15
Traditional learning analytics often focus on course completions rather than engagement, retention, or business outcomes. This session will show how organizations can evolve their approach by integrating xAPI, Power BI, and Power Automate to track learner interactions beyond pass/fail metrics—including behaviors such as video engagement, resource downloads, and post-training actions.
We will explore real-world case studies where learning analytics transformed business impact, shifting L&D from a cost center to a strategic partner. Through participation in hands-on exercises and discussions, you will leave with a blueprint for implementing data-driven learning strategies in your own organization. No prior experience with analytics tools is required, but a basic understanding of learning management systems (LMS) and corporate training structures will be helpful.
Sandie Dela Cruz
Sr. Manager Digital Solutions
Edwards Lifesciences
“Sandie Dela Cruz is a Senior Manager of Digital Solutions at Edwards Lifesciences, leading learning analytics, automation, and digital transformation initiatives. With expertise in xAPI, Power BI, and Power Automate, Sandie helps organizations move beyond compliance-based metrics to track meaningful learner interactions and demonstrate L&D’s strategic impact. She has successfully implemented scalable analytics frameworks that optimize training effectiveness, measure ROI, and align learning with business goals.
Sandie’s approach bridges technology and strategy, enabling learning leaders to leverage data for informed decision-making and position L&D as a key driver of business success.”
201: Bring Your Data to Life with Dynamic Visual PowerPoint
1:00 PM – 2:00 PM ET / 10:00 AM – 11:00 AM PT Wednesday, April 15
In this session, you’ll see how to bring data to life. We’ll address strategies to use PowerPoint to approach data visualization and data storytelling based on your audience, your objective, the use case, and within any requirements set. You’ll explore techniques to create suitable graphs, charts, and diagrams that convey the key ideas in an elegant and memorable way and help your audience to understand what’s important, why it matters, and what they should do as a result.
You’ll also learn about various approaches to presenting or reporting this kind of information with effective structures for one-pagers, interactive reports or PDFs, responsive presentations, or interactive decks.
Richard Goring
Director
BrightCarbon
301: Measuring What Matters: A Practical Starting Point for Learning Impact
2:30 PM – 3:30 PM ET / 11:30 AM – 12:30 PM PT Wednesday, April 15
Rather than pursuing perfect attribution, our approach focused on selecting a small set of meaningful metrics, establishing clear criteria for what to measure, and aligning learning to business priorities using existing, easy to gather data.
This session will share the design decisions, assumptions tested, lessons learned, and how the approach evolved once theory met reality. You will learn to evaluate learning impact options that fit your context and constraints and identify practical first steps for exploring learning impact. You will walk away able to use clear, shared language to discuss with stakeholders the learning impact and business alignment of your work.
Amy Colasanti
Learning Alignment Supervisor
AdventHealth
Natasha McIlmurray
Learning Quality Assurance Specialist
AdventHealth
401: The L&D Metrics Hierarchy: Mapping Learning Data to Business Outcomes
11:30 AM – 12:30 PM ET / 8:30 AM – 9:30 AM PT Thursday, April 16
In this hands-on session, I’ll introduce the L&D Metrics Hierarchy—a four-tiered framework developed to help Fortune 500 companies align learning metrics with business outcomes. As we explore each tier: Business Impact, Performance Outcomes, Learning Engagement, and Operational Efficiency, you will learn to use them to separate signal from noise. Together, we’ll learn to map your current metrics to strategic goals, uncover measurement gaps, and select the right visualizations to tell your story. You’ll leave with a practical framework, real-world examples, and clear steps to design dashboards that drive decisions.
A digital workbook and sample datasets will be provided for download via a QR code. The presenter recommends becoming familiar with the free version of Datawrapper or Flourish Studio, or open-source RAWGraphs, for chart creation.
Monica Gragg
Director, Talent Management
Onward Energy
501: Showing Value While You Build
1:00 PM – 2:00 PM ET / 10:00 AM – 11:00 AM PT Thursday, April 16
We will look at ways to talk about your L&D projects while they are still taking shape and how you can share early wins and progress in ways the leaders will trust. You’ll also learn how to set clear expectations with leaders during periods of change and communicate momentum without overselling results. We’ll explore practical examples and real scenarios, enabling you to walk away with simple ways to explain your work, build credibility, and keep leaders informed while your learning programs continue to evolve.
Armando Contreraz
Corporate Training & Development Specialist
Wireless CCTV USA
601: Speaking Data: The Language of Impact and Behavior Change
2:30 PM – 3:30 PM ET / 11:30 AM – 12:30 PM PT Thursday, April 16
This session reframes data as a language, moving from semantic reporting (what each survey question literally says) to pragmatic meaning (insights interpreted in context to drive behavior change). You’ll see how to use AI and pattern analysis to identify meaningful patterns in your mix of quantitative and qualitative data. These “”experience patterns”” can then be integrated into a strategic behavior-change approach, such as MOJO (Motivation, Opportunity, Job Capabilities, Outcome), to inform recommendations.
You will leave this session equipped to pull contextual meaning from data and provide it to leaders in an actionable way that connects learning results to capability, opportunity, and clear outcomes. You’ll also be able to communicate impact as a strategic narrative, aligning recommendations to behavior change and organizational goals.
Zsolt Olah
Sr. Data Measurement Analyst
Intel